


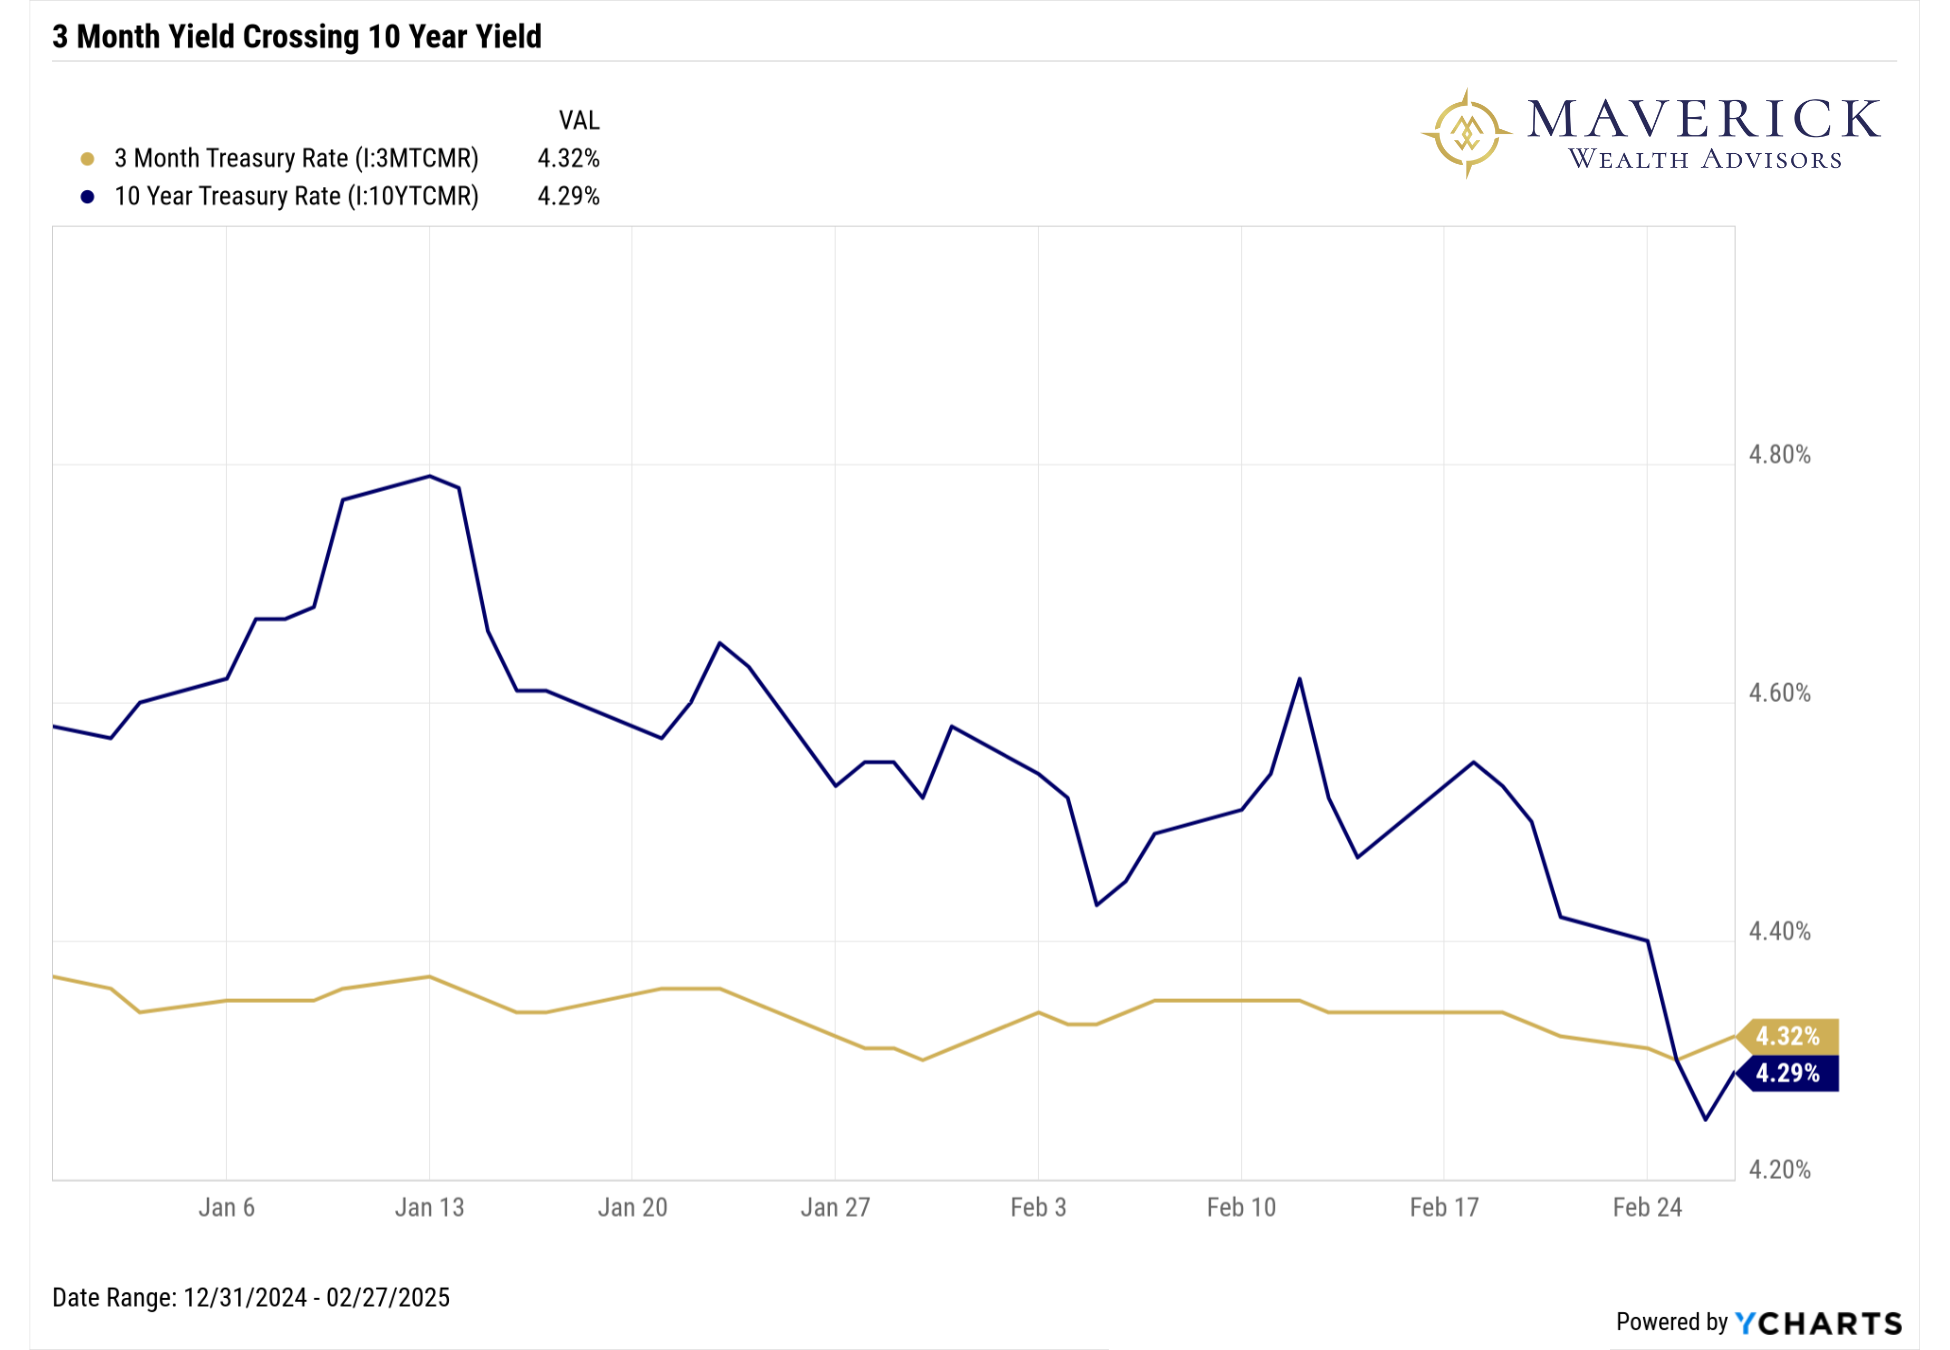
If you’ve been scrolling through financial news lately, you might’ve stumbled across chatter about the yield curve inverting—specifically, the 3-month Treasury yield climbing above the 10-year yield on February 24, 2025. It sounds like jargon, but it’s a big deal for anyone with money in the stock market. So, what’s it all about, and how should it shape your portfolio? Let’s unpack it.
The Basics: What’s a Yield Inversion?
Picture this: normally, when you lock your money into a 10-year Treasury bond, you earn more interest than you would with a 3-month Treasury bill. It makes sense—longer commitments, bigger rewards. But when the 3-month yield flips higher than the 10-year, that’s an inversion. It’s like the financial world saying, “We’re more worried about the next few months than the next decade.” Investors rush to safe, long-term bonds, pushing those yields down, while short-term rates spike. And it’s not just a random blip, since the 1950s, this flip has flagged every U.S. recession, usually 6 to 18 months ahead of time.
Why it matters for stocks:
Here’s where your portfolio comes in. An inversion isn’t a “sell everything” siren, but it’s a signal to pay attention to. Historically, it’s sparked a few possibilities for the stock market:
- Storm Brewing on the Horizon: The recession link often rattles investors. Stocks tied to economic growth (think tech, industrials, or retailers) can get shaky as people brace for weaker earnings. Volatility tends to creep up, and broad indexes like the S&P 500 might stumble.
- The Waiting Game: Stocks don’t always tank right away. After the 1989 inversion, the market climbed 20% before the 1990 recession hit. That lag can mean opportunity if you’re perceptive.
- Not Every Smoke Signal Means Fire: In 1998, an inversion popped up, but no recession followed—just a brief scare. Global events or Federal Reserve moves can sometimes dodge the bullet.
What should you do with your Portfolio?
Your money’s on the line, what now? An inversion doesn’t demand a total overhaul, but it’s a nudge to rethink your strategy. Here are some tactical moves:
1. Lean More Defensive: If storm clouds are gathering, stocks in “boring” sectors like utilities, healthcare, or consumer staples often hold up better. Growthier sectors like tech, financials, and consumer discretionary could experience larger drawdowns.
2. Cash is King (Sometimes): With 3-month yields spiking (maybe hitting 4% or 5%) short-term Treasuries or money market funds start looking tempting. Parking some cash there can give you flexibility to buy stocks later if prices dip.
3. Watch, Don’t Panic: The lag between inversion and recession (if it even happens) means you’ve got time. Keep an eye on corporate earnings, Fed rate decisions, and economic data like jobs reports. They’ll clue you in on whether this is a blip or a trend.
The Big Picture
An inversion doesn’t mean “sell everything” on day one, but it’s a heads-up. The stock market might churn higher for a bit, giving you time to tweak your portfolio, maybe trim riskier bets and lean into steadier names. Or it could signal a slow grind toward a downturn, where cash starts to feel smarter than stocks. Either way, it’s less about predicting the exact outcome and more about watching how the market reacts because perception often drives reality here.
At Maverick Wealth Advisors, it’s our job to keep an eye on these signals whether it’s a storm brewing, a fuse counting down, or just smoke without fire. We’ve got a plan to help our clients navigate these twists and turns. The key? Don’t let headlines dictate your moves, let them inform your thinking.
Advisory Services offered through Concurrent Investment Advisors, LLC an SEC Registered Investment Advisor. Concurrent Investment Advisors, LLC d/b/a Maverick Wealth Advisors are not affiliated companies.
Sources:
Barber, D. (2024, August 20). A recent history of inverted yield curves. Modern Wealth Management. https://www.modwm.com/a-recent-history-of-inverted-yield-curves/
Estrella, A., & Trubin, M. R. (2006). The Yield Curve as a Leading Indicator: Some Practical Issues. The yield curve as a leading indicator: Some practical issues - federal reserve bank of new york. https://www.newyorkfed.org/research/current_issues/ci12-5.html
Hayes, A. (2023, September 27). Yield curve: What it is and how to use it. Investopedia. https://www.investopedia.com/terms/y/yieldcurve.asp
McWhinney, J. (2024, August 11). The impact of an inverted yield curve. Investopedia. https://www.investopedia.com/articles/basics/06/invertedyieldcurve.asp